
HOMA-IR: The Insulin Resistance Marker Most NPs Are Not Calculating
May 06, 2026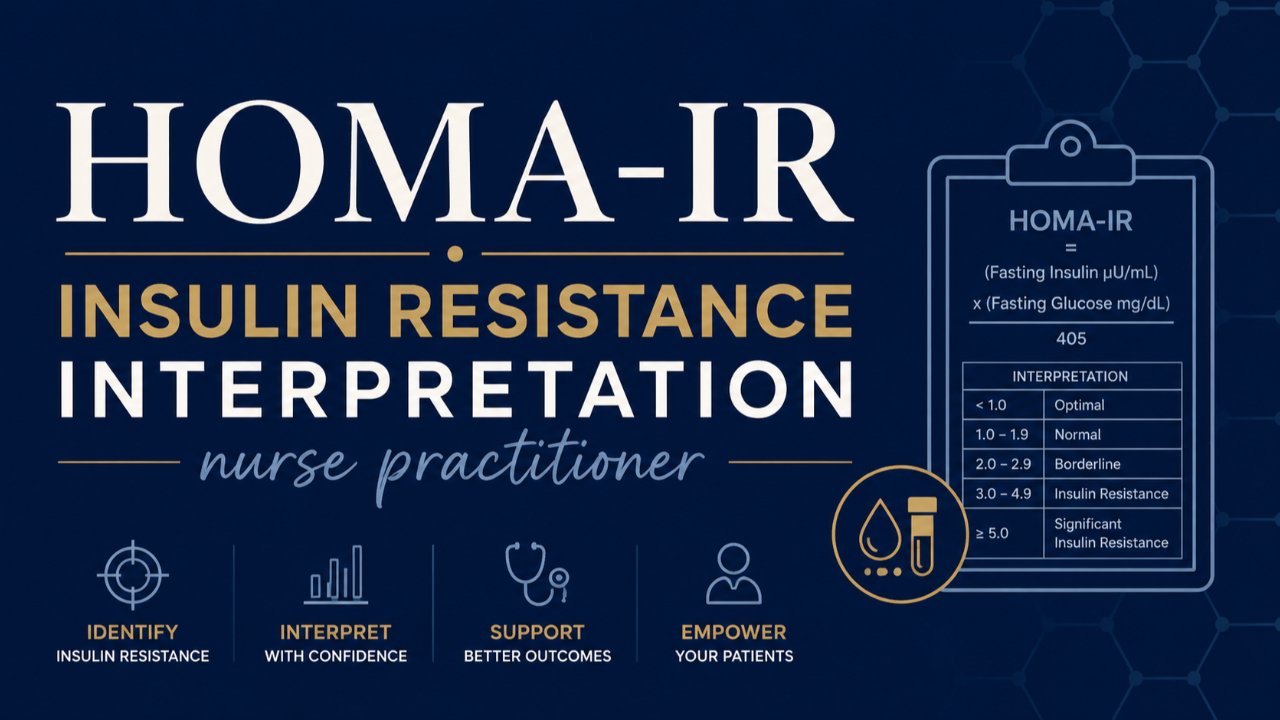
You order a comprehensive metabolic panel. The fasting glucose comes back at 97. HbA1c is 5.5 percent. Your patient does not have diabetes. She does not have prediabetes by conventional criteria. And yet she is exhausted, gaining weight around her midsection despite eating well, craving carbohydrates by mid-afternoon, and waking at 3 AM unable to fall back asleep.
Her labs say she is fine. Her body is telling you something different.
The number that would explain her presentation is one most NPs never calculate. It is called HOMA-IR, and it is one of the most clinically useful tools in metabolic medicine, sitting quietly in the data you are already collecting, waiting to be used.
What HOMA-IR Actually Measures
HOMA-IR stands for Homeostatic Model Assessment of Insulin Resistance. It is a simple calculation that uses two values you can order on any standard lab, fasting insulin and fasting glucose, to estimate how insulin resistant a patient is at the cellular level.
The formula is:
HOMA-IR = (Fasting Insulin x Fasting Glucose) divided by 405
A result below 1.0 is optimal. Between 1.0 and 1.9 is a yellow zone where insulin resistance is developing but has not yet progressed. Above 2.0 indicates significant insulin resistance. Above 2.5, a pharmacotherapy conversation becomes appropriate.
The patient in the opening scenario? If her fasting insulin comes back at 12 uIU/mL, which is technically within the conventional normal range of under 25, her HOMA-IR is 2.9. She is significantly insulin resistant. Her glucose is still normal because her pancreas is working overtime to keep it there. The lab that would reveal this has never been ordered.
Why Fasting Glucose and HbA1c Are Not Enough
Glucose and HbA1c measure the result of insulin resistance. HOMA-IR measures the process driving it.
By the time fasting glucose rises above 100 or HbA1c crosses 5.7 percent, the underlying insulin resistance has typically been present for years. The pancreas compensates for cellular insulin resistance by producing more and more insulin. Glucose stays normal. The patient looks metabolically healthy on paper. But the hyperinsulinemia, the chronically elevated insulin required to maintain that normal glucose, is already driving weight gain, inflammation, hormonal disruption, and cardiovascular risk in the background.
This is why so many patients experience the full symptom picture of insulin resistance while their conventional labs remain reassuring. The labs are measuring the wrong thing.
The Symptoms That Should Send You to HOMA-IR
Insulin resistance does not announce itself with an abnormal fasting glucose. It announces itself through patterns NPs see every day and frequently attribute to other causes.
Central weight gain that does not respond to caloric restriction. Afternoon energy crashes, particularly between 2 and 4 PM. Sugar and carbohydrate cravings especially in the late afternoon. Difficulty losing weight despite adequate effort. Waking between 2 and 4 AM, a pattern driven by nocturnal blood sugar fluctuation and the cortisol spike the body uses to correct it. Brain fog. Fatigue that does not improve with rest.
Skin findings are equally telling. Acanthosis nigricans, the velvety hyperpigmented plaques in the axillae and posterior neck, is pathognomonic for insulin resistance. Multiple skin tags on the neck and eyelids are a strong associated finding. These physical exam findings in the presence of any of the symptoms above should direct you immediately to a fasting insulin and HOMA-IR calculation.
What You Need to Order and What You Need to Know About the Reference Range
To calculate HOMA-IR you need a fasting insulin drawn at the same time as a fasting glucose. Both values must be fasting. The fasting insulin is the piece most NPs are not routinely ordering, and it is the piece that changes everything.
Here is the critical caveat: the conventional reference range for fasting insulin is almost always listed as under 25 uIU/mL. This is not a health target. It is a population reference range built from a population with a high prevalence of insulin resistance. A fasting insulin of 18 is within the conventional normal range and represents a HOMA-IR of approximately 4.0, which is significantly insulin resistant.
The BridgeWell optimal target for fasting insulin is 2 to 5 uIU/mL. A fasting insulin above 8 warrants lifestyle-based insulin sensitization. Above 15, a metformin conversation is appropriate. The conventional reference range will not tell you any of this.
What HOMA-IR Changes Clinically
When you start calculating HOMA-IR routinely, several things shift in your clinical practice.
You identify metabolic dysfunction years before conventional markers become abnormal. You have a specific, measurable number to show patients, which changes the behavioral conversation entirely. A patient who is told her labs are normal has little motivation to change. A patient who sees a HOMA-IR of 3.2 and understands what that number means has a reason to act.
You also gain a monitoring tool. HOMA-IR responds to intervention. Carbohydrate reduction, time-restricted eating, resistance training, and insulin-sensitizing supplements all produce measurable reductions in HOMA-IR within 8 to 12 weeks. This gives both you and your patient objective evidence that the protocol is working before any conventional lab value moves.
One Calculation. A Different Clinical Picture.
The patient at the start of this post is not metabolically healthy. She is metabolically compensated. Her pancreas is working hard enough to keep her glucose normal for now. HOMA-IR is the clinical tool that reveals what her fasting glucose is hiding.
Adding fasting insulin to your standard metabolic workup and calculating HOMA-IR takes thirty seconds and costs almost nothing. What it gives you is a window into the metabolic process your patient is living inside, years before it becomes the diagnosis you were trained to manage.
Clinical application requires professional judgment and should always be integrated with a thorough patient-specific assessment. These frameworks are intended to complement, not replace, individualized clinical evaluation.
If you missed last month's post on why thyroid patients are not getting better on medication, that is worth reading alongside this one.
Want a quick reference you can use in practice?
Download the free BridgeWell HOMA-IR Quick Reference Card. Covers the formula, interpretation ranges, the symptoms that should send you to fasting insulin, and what changes clinically when you start using this marker.
If you want ongoing clinical depth like this every month BridgeWell Practice Lab is where that happens. $67 per month. bridgewelled.com/membership